Jack Alegre
Staff Writer
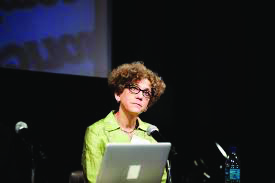
Seeking to understand how visual data impacts the way we think and process data, 30 people gathered in the intimate setting of the Davidson Library Collaboratory room last Thursday, May 24. The event was presented by Johanna Drucker, an author, visual artist, and the Breslauer Professor of Bibliographical Studies in UCLA’s Department of Information Studies.
Drucker began her lecture, “Modeling Interpretation: Changing Digital Humanities Visualization,” by expressing her enthusiasm for being back in Santa Barbara before delivering the central theme of her lecture. “After two decades, there are problems regarding visualization and representation,” said Drucker. Noting the advent of computers and digital media, her question then became how to “reformat in the context of the present digital humanities.”
The lecture was an exercise in critical hermeneutics. Hermeneutics is a discipline focused on interpretation, looking at the verbal and nonverbal cues in texts and communication to give context and meaning to what is presented before us.
A small woman with a shock of iron-gray hair and a voice that carried throughout the room, Drucker launched into a series of slides meant to show how the representations of data influence how people interpret it. For example, she compared an old colonial line graph with modern clip-art and pie chart graphs, musing over the loss of aesthetic sensibilities.
Part of the underlying question is whether all necessary data can truly be gleaned from just looking at a graph. By comparing a colonial graph, which made use of simple colors to delineate meaning, to the more minimalist graphs of today, Drucker contended that today’s means of visual representations are prone to leaving out important context and meaning.
Drucker also stated that “meaning cannot be assumed independent of the process of reading.” To reiterate this point, she brought up a screenshot of Google Ngram Viewer, comparing the search frequencies of the words “writer,” “poetess,” “poet,” and “novelist” against each other. She pointed out that, while we can see how frequent words appear with the Ngram, it does not speak to the significance of those words themselves.
She then turned her focus to ontology, the study of relationships and categories between things, to explain that humans are constantly looking for patterns and hierarchies to make sense of data. By ordering data in formats such as XML or graphs, humans are making decisions on which data is the most important. What has been lost over time, she suggests, is the argumentative insight necessary to make sure that all the relevant data truly is there.
Drucker closed her talk by opening up a small workshop for attendees interested in her field. Together, the group worked on exercises meant to identify the various strengths and weaknesses of different data visualizations.


